
Every year, consulting firm Gartner provides ranking in various technological fields on the best providers available. Their analyses culminate into a visual that positions companies on two criteria: “vision completeness” and “ability to execute”. Many use their conclusions, but what about incentives and transparency? Is it reliable? There are two sides to every coin.
In this blog, I dive into Gartner’s Magic Quadrant for Business Intelligence (BI) Platforms Market. What is it based on? What are the pros and cons? Is it for you? Read on to find out…
MAGIC WHAT?
Maybe you’ve heard the term Magic Quadrant before – whether it was at work a while ago, just recently, or all the way back during your studies. In any case, here’s a quick refresher.
Every year or two, Gartner publishes research based on proprietary qualitative data analysis. They look into the technology industry and demonstrate market trends, such as direction, maturity and participants. Their Magic Quadrant helps visualize key players in major technology markets and their positioning, thus providing a wide-angle view on the market’s competitors and a company’s relative position. These companies are identified as fitting one of four categories:
- Leaders: execute based on their current vision, and are the most future proof entities.
- Challengers: execute well now and may dominate a large segment, but do not have a sense of where the market is going.
- Niche players: successfully focus on a small segment, and/or do not outperform or out-innovate others.
- Visionaries: see where the market is going, and create a vision for changing market rules, but have yet to execute them to their full extent.
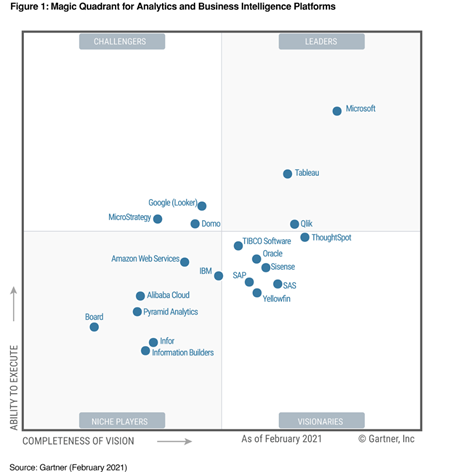
Gartner published its latest Magic Quadrant for Analytics and Business Intelligence Platforms in February 2021.
Now that we’re all on the same page, let’s have a critical look at this Magic Quadrant – the good, and the bad.
THE GOOD FOR ANALYTICS AND BUSINESS INTELLIGENCE PLATFORMS?
“Crowdfunded companies or ones of smaller scales are not considered at all in Gartner’s analyses.”
A thorough overview, give or take
Simply looking at the visual helps identify clear Leaders, as well as Niche Players that stand out. In a matter of seconds, anyone looking at this Magic Quadrant would end up being more informed of the market than they were seconds earlier. They’d know that Amazon Web Service is a well-recognized niche player, and that Microsoft seems to lead this industry by quite a margin. Overall, Gartner’s Magic Quadrant provides a decent snapshot of an entire market.
However, crowdfunded companies or ones of smaller scales are not considered at all in Gartner’s analyses. If you’re part of an SME, Gartner’s Magic Quadrant is likely of low relevance to your company. In my experience, it could even be that a much smaller, possibly local, provider meets all your needs and beyond, for a fraction of the price. Of course, such a local provider would never make it on Gartner’s radar, unless they’d be willing to pay.
Different perspectives
“What about the shadier parts? Who’s paying for these and what’s it really useful for?”
Probably its most practical feature: Gartner provides thorough comparisons from one vendor to the next, and publishes hundreds of individual use-case reviews. A quick browsing session will tell you about each platform’s key selling point, such as Qlik Sense’s fast data modelling solution, and Tableau’s ability to get the job done. Overall, Gartner shares that they base their ranking on more than their own analysts’ conclusion; they use market sentiments, individual reviews, usability testing, and more.
They certainly don’t cut corners and have a reputation to hold up to, but what about the shadier parts? Who’s paying for these and what’s it really useful for?
THE NOT SO GOOD FOR BI PLATFORM SEEKERS
“Beyond being some sort of eye candy, the Magic Quadrant doesn’t provide nearly enough information to be used in decision-making.”
“A picture is worth a thousand words. If you know how to read it” – Alberto Cario Ph.D.
In research, graphics are meant to be a guide for readers. However, with Gartner’s Magic Quadrant, users have to guess the numbers on each axis. Analysts have also found that there is an underlying bias where the value for “Completeness of vision” is inexplicably worth more than “Ability to execute”. Would both elements weight the same, some players would be classified as leaders in the market, instead of challengers.
This visual doesn’t say anything about criteria, and blends in many critical categories such as pricing and accessibility. Beyond being some sort of eye candy, the Magic Quadrant doesn’t provide nearly enough information to be used in decision-making.
Lack of transparency
With a lack of transparency in their methodologies, any buyer or seller needs to be cautious – nowhere does Gartner say how the X and Y axis scores are composed and how exactly each firm is positioned. The extent of their methods can be found here. I don’t know about you, but to me, this mostly looks like marketing mumbo jumbo. They don’t divulge much.
Especially for BI platforms, not knowing the exact weight given to key criteria such as user interface, integration, and pricing makes this Magic Quadrant difficult to use objectively.
Conflict of interest
“A third of Gartner’s income comes directly from vendors. Who, how much, and what for is not public.”
As required to report on their financial statement, anyone can see that a third of Gartner’s income comes directly from vendors. Who, how much, and what for is not public. If they were privately held, we would have no easy way of confirming this blatant conflict of interest.
With its newest 2021 Magic Quadrant, Microsoft was identified as a Leader for the 14th consecutive year. Whether it has been funding part of Gartner’s research or not remains a mystery. The same can be said of Tableau, entering its 9th year as a Leader according to Gartner’s analyses.
…The Magic Quadrant may just be losing its touch in light of fast paced changes.
“Gartner unavoidably influences the market it is trying to objectively analyze.”
Remember I mentioned crowdfunded companies don’t make the cut? This creates more problems: for one, it leaves out an up-and-coming segment that could completely disrupt how things are looking in the tech world. And for two, by continuously putting certain players at the top, Gartner creates its own self-fulfilling prophecy. By promoting a certain player to the top, more buyers become interested in them, meaning that Gartner unavoidably influences the market it is trying to objectively analyze.
What’s worse, reports produced by Gartner are often months out of date when published. In such a critical and fast-paced field as is business information technology, this alone can tip the scale.
CONCLUDING THOUGHTS
“Use Gartner’s Magic Quadrant simply as a quick scan of the market.”
In theory, Gartner’s Magic Quadrant for business intelligence provides the perfect overview one could ask for in terms of technology players. In practice, the Magic Quadrant is mostly an eye-catcher.
As a consulting firm, Gartner makes their money by publishing these tools and articles, so everything should be taken with a grain of salt. It is not to say that they don’t provide some valuable insight in the decision-making process.
Magic Quadrant for Business Intelligence: yay or nay?
All in all, I’d recommend people who are shopping around for a new BI tool to use Gartner’s Magic Quadrant simply as a quick scan of the market. For such a critical decision, you need facts and demos to find what’s best for your needs. For more personalized and up-to-date data, local research companies may also do the trick for you.
One thing is certain though: knowledge is power… and knowledge comes around from data that you’ve turned into actionable information. Therefore, data is power. If your company doesn’t have a BI platform to transition from data to knowledge, I have a simple question for you: Why?