
Data engineer, data analyst… For many employers, the difference isn’t clear, and neither are all the software skills they should ask for. On job boards, Python, SQL, and Power BI continue to be highly requested. If you want a career in data, make sure you master these three skills. Meanwhile, R, Tableau, and Excel take a back seat. What other trends can we notice? Read on to find out!
IN SHORT
A trinity, a downtrend, and a few underdogs. Software skills required for data jobs are shifting.
SQL and Python continue to be some of the most demanded skills for data experts, particularly data engineers. Yet, since the pandemic, Python experienced a downward trend, possibly because of the recent popularization of low-code solutions and its many alternatives. SQL is the clear winner this year.
Meanwhile, Tableau wins in terms of pure analytics capabilities, but Power BI is the one employers ask for. This is largely thanks to its accessibility and business intelligence focus for analysts and all involved. SAS, Qlik, Stata and SPSS skills are still desired by employers, but not nearly as often as the rest.
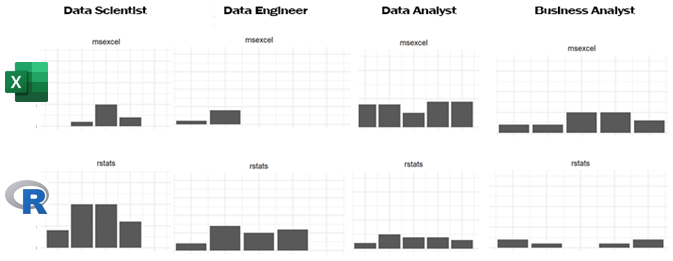
Excel continues to be demanded across industries as a complimentary and beginner friendly tool. Finally, R sticks around as a more niche skill, especially required for data scientists and in academia.
AN OVERVIEW OF DATA JOBS
Data jobs are those that help companies pinpoint data needs, collect said data, analyse it, and make it meaningful to decision makers.
Data science is transforming organizations and promoting growth in the global economy. It’s data experts that make the difference.
Data jobs is an umbrella term that covers few of most demanded roles on the market; AI & machine learning experts, data architects, and data analysts, to name a few.
…Data what now?
On few job boards, whether here on Vorsers.com, or on the Dutch variant DataJobs.nl that specifically focuses on data specialists, five data jobs are often asked for. To be honest, they can get confusing for the uninitiated, so here’s a few lines for each to get you acquainted:
- Data scientist: Busy with analysing and interpreting complex (big) data. This role often encompasses a wider variety of skills, such as advanced statistical analyses, deep knowledge of data conditioning, and machine learning.
- Data engineer: Involved in preparing data, including developing, constructing, testing and maintaining architecture. More technically inclined with strong knowledge on creating and integrating APIs, they know about data pipelining and often work towards performance optimization.
- Data analyst: All about analysing numeric data and supporting the organization in making better decisions. More often a starting position compared to others on this list, they need to know about data handling, modelling, and reporting. They transform data into information. You can read more about the process of hiring a data analyst through a recruiter’s eyes here.
- Business analyst: Gathering, validating, and documenting business requirements and most often engaged with IT and business transformation projects. They help define business problems using both technical and non-technical information and create solutions.
Data science is transforming organizations and promoting growth in the global economy, and ultimately, it’s data experts like the few listed above that make the difference. They provide more transparency, continuous improvement, accountability, performance, and much more. But what kind of software skills are asked of them exactly? Well, there’s a few…
SOFTWARE SKILL SHIFTS IN DATA JOBS
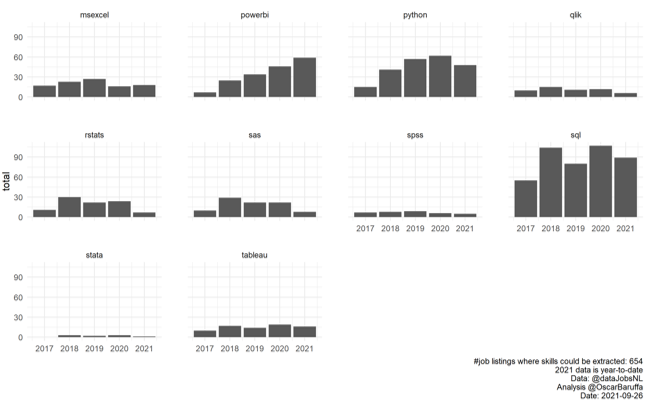
We see a definite trinity of highly demanded data job skills this year: SQL, Power BI, and Python.
Skill trends & insights
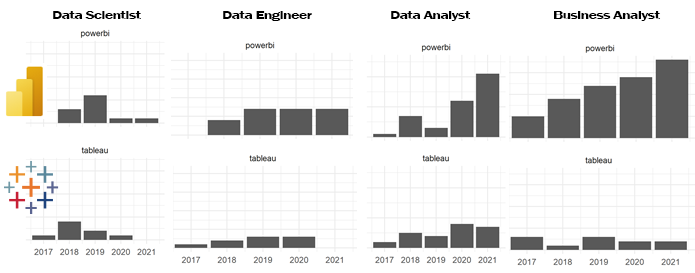
SQL & Python are still some of the most prevalent software skills in the field of data engineering and analytics, long ahead of other skill requirements. For business and data analyst roles, it’s Power BI that has seen a surge in recent years.
Inversely, as per 2021 data from DataJobs.nl, Python has seen a decline in popularity for data scientist jobs.
When looking at the bigger picture, we see a definite trinity of highly demanded data job skills this year: SQL, Power BI, and Python. While these rise to the top, SAS, Qlik, Stata and SPSS stay low, and Excel, R, and Tableau remain the useful-yet-less-demanded underdogs.
While data experts end up having to combine many of the skills mentioned above, job ads rarely ask for multiple in one post – they tend to be more focused. Odd, isn’t it? Perhaps it’s to hire what they’re particularly lacking in, taking other skills for granted, or it’s because, more often than not, the hiring process lacks insights from fellow data experts.
Strong but unstable demand for SQL & Python
There’s a huge trend towards low-code solutions which, on paper, help build apps and transform organizations faster.
In a nutshell, SQL is an open-source system used to manage relational database that is relatively easy to learn. At its core, it’s a tool for data access, extraction, and query.
Python, on the other hand, is more versatile with a higher ceiling in terms of mastery. It’s a programming language used in web development, analytic, prototyping, and more. It enables more experimentation with the data.
Both have their merits, and both can work hand-in-hand.
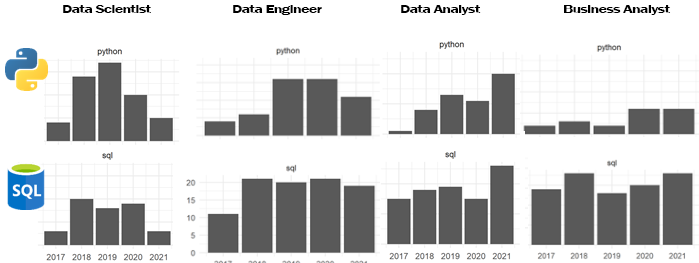
As one could expect, employers don’t expect business analyst to know about the more complex programming language that is Python, in fact, this year the demand for SQL was matched by that of Power BI instead. And for data analysts, there was a huge spike in demand for both Python and SQL. A shift from specialist to generalist?
Meanwhile it’s the complete opposite for data scientists, which have to know the ins and outs of Python, albeit on a downward trend. How comes?
Both Python & SQL are generally of high interest, yet experience a descending incline. One reason can be that employers ask one of many alternatives instead, such as Java, C++, NodeJS, Ruby or PHP. It could also be because of the low-code or even no-code solutions trend which, on paper, help build apps and transform organizations faster. This means little to no need for programming knowledge.
Tableau vs Power BI: A duel in analytics
There’s simply much more awareness towards Power BI than Tableau, and its user-friendly interface makes it easier for all stakeholders to get involved.
Tableau is a powerhouse in terms of data visualisation and analytics. For those who are well acquainted with data analysis, this tool feels right at home, especially for data cleaning and transforming into visualisations.
Meanwhile, Power BI offers a more beginner friendly interface along drag-and-drop features. It’s the most welcoming to all stakeholders and those just getting started in the field.
Nonetheless, it’s Tableau that wins when it comes to pure analytics; whether it’s about speed or features. This tool is made for experts to make the most out of data.
Yet… Power BI is the one that is on the rise. It soared during the pandemic and has yet to stop. Especially among data and business analyst roles.
Why? I can think of a few reasons.
Power BI is part of the Microsoft suites, making it extremely accessible and cheaper for many organizations. It’s a brand they know and trust, for a cost they can get behind.
Generally speaking, there’s simply much more awareness towards Power BI than Tableau, and its user-friendly interface makes it easier for all parties to get involved and easily gain insights. It’s the go-to tool for business intelligence. What’s more, it’s free for personal use, so it’s relatively easy to get acquainted with it. Employers are more likely to find analysts experienced with this tool over Tableau.
R & Excel: the stable underdogs
R has a lot to offer. It being under a general public license means there’s no restriction on its usage. Since it’s so accessible, anyone can get acquainted with programming through it and build dynamic web-apps while enjoying vast community support.
What’s more, people use R across many industries; from finance to medical. It’s the go-to language for statistics. That’s why R is still so commonly asked for in data scientist roles, and even more common in academia. It’s developed for statistics, by statisticians.
As for Excel, while limited when it comes to volume and maintainability, it can still do great with general data tasks, particularly for small or medium-sized companies. In the end, it’s easy to get started with, and it offers great integration, but has limited rows and oversimplified analytic options. It’s there to stay, but shouldn’t be used alone when it comes to dealing with large datasets.
LOOKING BACK
Since 2020, the software landscape has not drastically changed in terms of composition, but it definitely has in terms of scale. As things shifted to digital, companies that were lagging behind started realizing the importance of data and the subtleties between various data jobs. On top of that, Power BI became more sought-after as 2021 propelled many newcomers into the field.
What’s ahead for software skills?
Growth continues to be exponential when it comes to data science and business analytics. In fact, it’s grown by over 650% since 2021 according to LinkedIn.
Companies, small and large, can no longer maintain a competitive advantage without data jobs to support them. Although few software skills are shifting in demand, the core is there: decision makers need data and data experts to turn it into information if they wish to succeed.
Have you found your data specialist(s)?
Statistics used in this article come from five years’ worth of data collected from the Netherlands’ largest job board for data specialists: DataJobs.nl, which connects data employers to employees, and cuts out recruitment agencies.